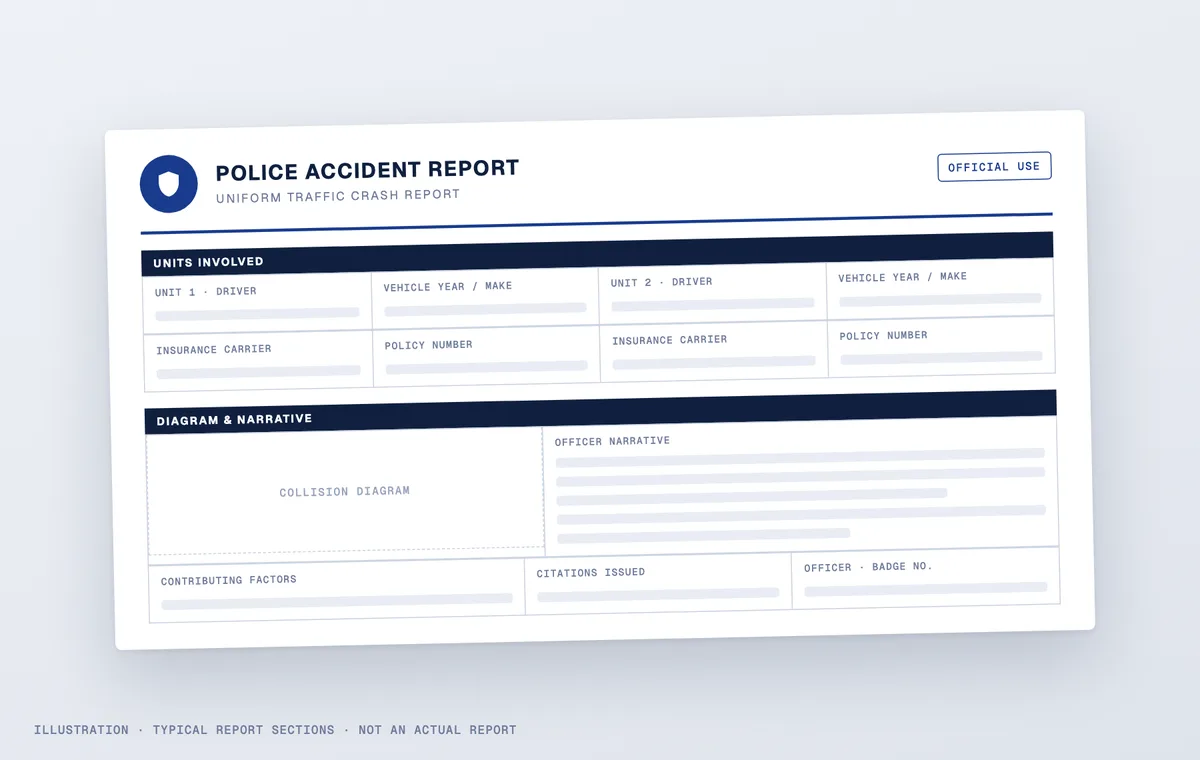
The aftermath of a traffic collision can be frustrating and overwhelming, especially if you sustained serious injuries. If you plan to pursue a claim, a police report will be the most important document. At AccidentReports.com, you can search our crash report information center and locate your report as soon as it’s available.
At AccidentReports.com, we offer a fast, simple, hassle-free way to obtain a copy of this important document.
Get your Phoenix, Arizona accident report
Easily Find & Obtain Your Police Car Accident Report Now
This website is a pooled attorney advertisement. AccidentReports.com is not a law firm or a lawyer referral service, and nothing on this site is legal advice. Disclaimer
Last updated
267Source: NHTSA FARS 2024 Annual Report File
Fatal crashes in Phoenix, 2024
279Source: NHTSA FARS 2024 Annual Report File
Deaths in Phoenix fatal crashes, 2024
23.9%Source: Computed from the NHTSA FARS 2024 Annual Report File
Share of Arizona's 1,118 fatal crashes, 2024
62%Source: Computed from the NHTSA FARS 2024 Annual Report File (162 of 260)
Of fatal crashes with a known time happened between 6 p.m. and 6 a.m.
Crash-level figures are from the NHTSA FARS 2024 Annual Report File, the latest year published; the file can still be revised.
Phoenix quick facts
Phoenix quick facts list the newest sourced crash figures for Phoenix, taken from NHTSA publications.
Fatal crashes, 2024: FARS records 267 fatal crashes and 279 deaths in Phoenix.
Latest fatal crash in the 2024 file: Dec 30, 2024, on N 32ND ST, Maricopa County.
Figures come from NHTSA; the 2025 numbers are early estimates and NHTSA revises them in early 2027, and the 2024 crash-level file can still be revised.
How fatal crashes happened in Phoenix
The bars count Phoenix's 2024 fatal crashes by manner of collision, as coded in FARS. The first-listed type is the most common.
At AccidentReports.com, you can take advantage of our intuitive crash report information center and search for your traffic police report as soon as it’s available. To get started, fill out the form on this page and submit your accident information.
How to Get Assistance with Locating Your Collision Report
Obtaining a copy of police public records in person or through the mail can be inconvenient for many people. If you were involved in an accident out of town, in another state, or you have a busy work schedule, then retrieving a copy of your report in person can be a major inconvenience. Waiting for a copy of your police report or the crash report to arrive in the mail can take several days or weeks, depending on how busy the police department is.Getting assistance with locating your Phoenix accident report from AccidentReports.com is the fastest, simplest, and most convenient way to obtain this important document. To get started, fill in the accident information form on this page. Fill Out the Form on this Page to Begin Your Online Accident Report Search
Agencies serving Phoenix
These agencies hold crash reports for Phoenix. Open one to see how to request its reports.
These are fatal crashes in Phoenix recorded in NHTSA's Fatality Analysis Reporting System (FARS) for 2024, the latest year NHTSA has published crash-level data. FARS counts 267 fatal crashes and 279 deaths in Phoenix that year; the table lists the 25 most recent, newest first. The 2024 file is NHTSA's Annual Report File and can still be revised. A dash means the field was not reported or the crash happened outside city limits.
You can use the crash report information center available from AccidentReports.com and get assistance with locating your crash report, or you can obtain a copy of your report from the local law enforcement agency.If you were involved in a traffic accident in Maricopa County, you can request a copy in person, via mail, or online. Per city policy, reports that are investigated and reported by the Maricopa County Sheriff’s Department or the Arizona Department of Public Safety are not available from the Phoenix Police Department. Reports for accidents that involve fatalities, hit-and-run accidents, or accidents that are still under investigation may be delayed and not available for immediate release.The process of obtaining a copy of your crash report is similar to obtaining a copy of a Phoenix PD report. In some cases, if there is no criminal investigation, it can be much easier. If you were in a motor vehicle accident, you will receive a slip with an incident number. To obtain a copy, you can visit the police department that the report was filed from and exchange your slip for a copy of the crash report. This can be done in person or through the mail. You can also visit sites such as AccidentReports.com to receive a copy of your report.If you fail to obtain a copy of the report, your insurance company or the law firm that represents you will need to request a copy through the mail.
The following types of information may be included in an accident report:
Identifying information for every party involved in the incident or accident, such as their full name, driver’s license number, date of birth, and phone number.
Date of the incident
Location of the incident or accident
Responding police officer’s full name and ID number/badge number
The names of back-up trooper on the scene
Drawing or diagram of the scene
The names of anyone who witnessed the incident and their statement
Reference number
Lighting, road, and weather conditions at the accident scene
Description of any damage sustained to all vehicles involved in the collision
For an auto accident, the document may also contain vehicle information, including specific information regarding all vehicles involved, license plate numbers, and who the responding law enforcement officer believes was the at-fault driver.
By law, you are not required to hire an attorney if you have been injured in an auto accident. However, if you plan to pursue a claim for compensation, working with an attorney who has experience in personal injury law and complex car accident claims can ensure you receive a higher settlement or award.
It can take a few days up to multiple weeks to obtain a copy of an accident report if you were directly involved. However, if you weren’t directly involved, or if you’re an insurance agent, it can take longer.
You can find resources online that can provide a copy of your crash report. At AccidentReports.Com, we provide a faster, more convenient way to obtain a copy of your police report.
In most cases, a police chief will require a law enforcement officer to file an accident report within twenty-four hours. Administrative investigations, active criminal investigations, or a report that was filed late can impact how soon a report is available.
If you were involved in a traffic accident, your insurance company will need a copy of your AZ crash report. If you want to pursue an independent investigation for a legal claim for compensation for damages, your accident lawyer will need this important document. Experienced accident attorneys use police reports to build strong claims for compensation against the driver at fault.
You can purchase the public record report from the Phoenix Police Department for $5. In some cases, the cost of the report may be more, depending on how many pages are in the report. Average costs range from $5-$20.
Information you need to find your Arizona police report:
The location of the accident
Date and time of the accident
Full name of the driver or passenger
Case ID number
Requesting a Police Report in Person At the Phoenix Police Department
If you want to request a copy of a report in person, first, bring a form of identification, such as a driver’s license, Arizona state-issued ID, or a passport. If you were directly involved in the accident, whether you’re a defendant, plaintiff, or witness, you may have received a verification slip from law enforcement to inform you that a police report was filed. You must bring this slip with you and exchange it for a copy of the police report.Normal business hours are:Monday-Friday: 8:00am – 4:00pmSaturday and Sunday: Closed
Public Records Online Request Form
To obtain a copy of your accident report from the Phoenix Police Department, you must provide a statement of purpose and description, per Arizona Public Records Law (A.R.S. 39-121). This form is provided by the city of Phoenix to ensure accurate and timely fulfillment by aiding in reporting, workflow, and clarification. If you need help filling out this form, you can visit the City Clerk Department at City Hall, 200 W. Washington, 15th Floor, Phoenix, or you can call (602) 262-7177.
Need your Phoenix, Arizona accident report?
Tell us the crash date and the responding agency and we will help you find the report.